Monitor kelp biomass and quality to help predict yields.
GreenWave Resource
Track the change in biomass on your farm – Growth Rate Data Collection Protocols
Back to: Monitoring & Maintenance
You likely won’t see any growth on your lines for the first month, but by late December or early January you should see 1-inch long sporophytes (kelp blades) start to emerge from your growlines. If the air is near or below freezing, we recommend trying to resist the urge to pick up your growlines every time you visit your farm. Keep your kelp submerged as much as possible while it’s still young and vulnerable.
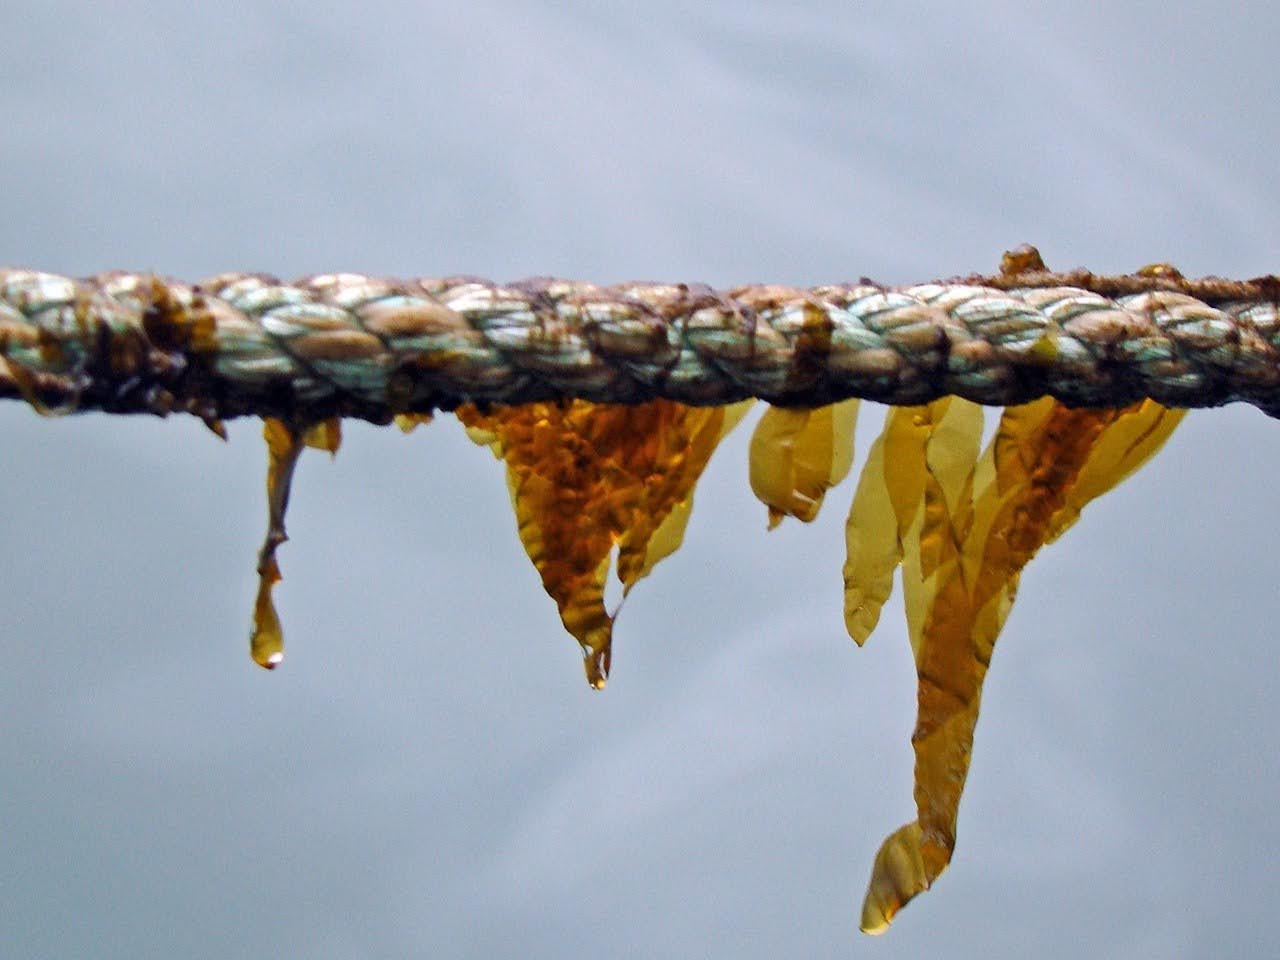
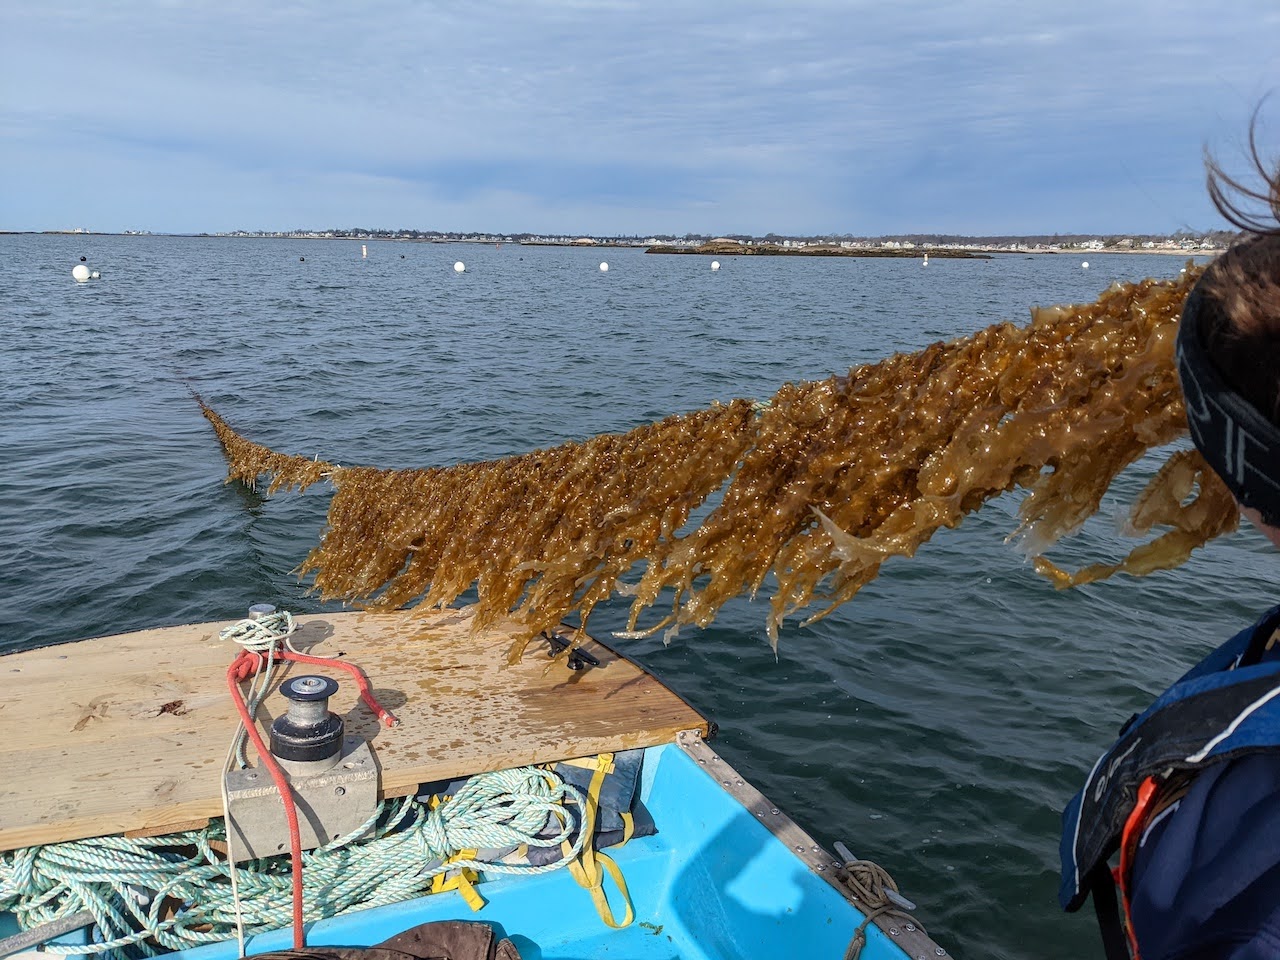
Depending on your region and when you outplanted, by February or March you should see several inches of visible growth on your lines. This is when it makes sense to start collecting monthly data on the growth rate of your crop.
Not all farmers do this, but if you’re interested in charting the growth of your kelp, it can give you some insight into how your crop is changing over time, help you communicate an estimated total yield to your buyer, and compare trends from season to season.
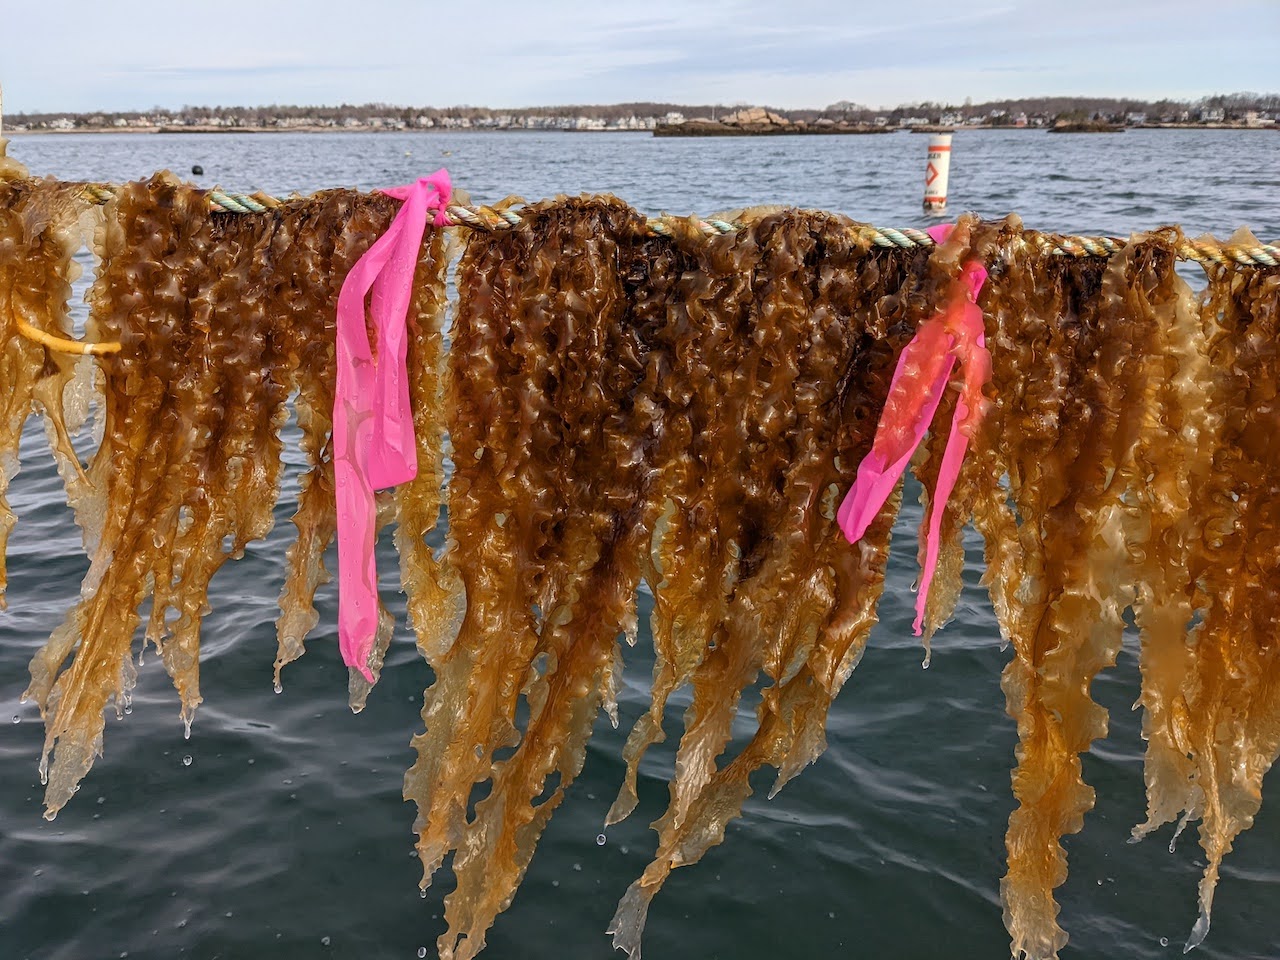
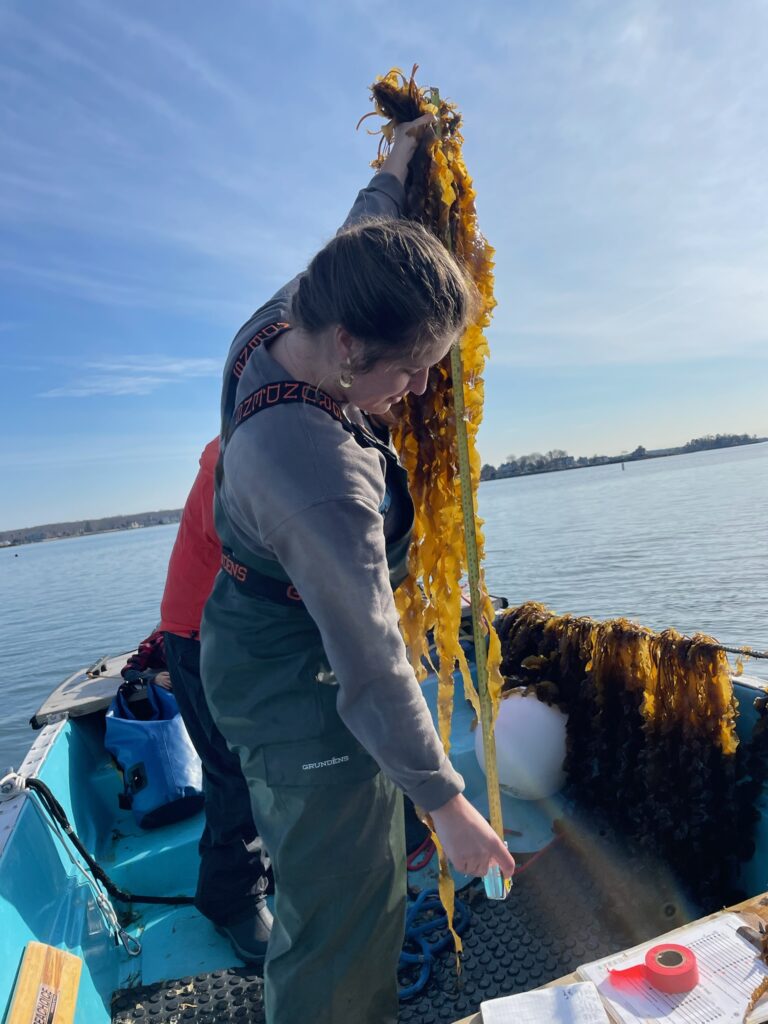
To do this, we recommend designating three easily identifiable spots on different growlines on your farm that you can return to each month to take measurements. It may help to mark them with something visible like the surveyor’s tape. Use a ruler or tape measure to measure a 12-inch section of growline. Inspect the kelp for biofouling and take a picture. Cut the kelp off the growline from this section and place it in a mesh bag. Use a hanging scale to record the weight.
Using these measurements it’s possible to graph the growth rate of kelp on your farm over time. Charting this curve can indicate at what point in the season your kelp is growing the fastest, and help inform your decisions on when to harvest. In this video, Bren describes the process of monitoring biomass and quality, and how this data can be used to predict yields.
As you get close to harvest, you may want to use some of your collection data to estimate your total farm yield. To keep up-to-date notes, it can be helpful to draw and annotate a working map of your farm with the information you’re seeing in the field. Download and use this harvest tracking map from the GreenWave farm as a template.